August 2010 Commentary
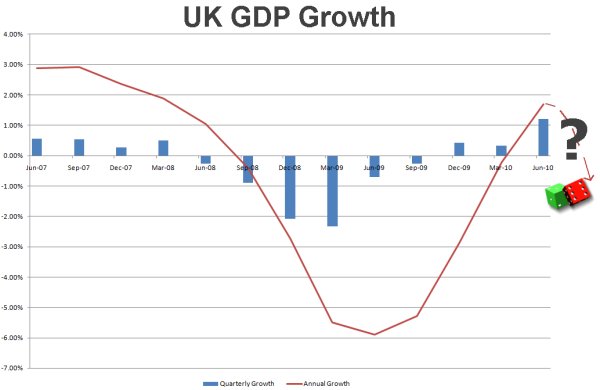
Figures published this morning by the Office of National Statistics showed that GDP increased by 1.2% in the second quarter of 2010, the strongest quarterly growth in nine years. This growth is 1.7% higher than the second quarter of 2009.
The main drivers of expansion were household expenditure, construction and inventories. Household expenditure rose 0.7% compared with a fall of 0.1% in the first quarter of 2010, which was due to a boost in sales from the World Cup coupled with the adverse effects of the VAT hike, bad weather in January and pre-election uncertainty which had depressed Q1 growth. Construction output rose by 8.5%, revised up from 6.6% in the preliminary estimate, showing the highest growth since 1982. Inventories rose by £1.0 billion on the quarter.
However, gross fixed capital formation fell 2.4% but remains 3.1% higher than the second quarter of 2009. Output in the service industries was revised down to 0.7% from the preliminary estimate of 0.9. A rise of 1.5% in business services and finance was offset by a fall of 2.2% in transport, storage and communications services, reflecting the cost of the volcanic ash cloud in the transport sector.
Whilst on the face of it these growth figures appear positive, Lena Komileva, Head of G7 Market Economics at Tullett Prebon, thinks that a double-dip recession in the UK in 2011 could now be on the cards: .
"The second quarter's expansion was driven by consumer spending, construction and inventories, rather than by cyclical investment and exports, indicating that growth came at the expense of a reversal of the economy's rebalancing. Weaker labour earnings and falling house prices will weigh heavily on consumer spending over the coming quarters, which together with fiscal austerity, banking system fragility and slowing growth in the US and Europe raises considerably the chances of a double-dip recession in the UK in 2011."
Sources: Office for National Statistics and Tullet Prebon G7 Economics

 In the UK there are two key measures of price inflation, the consumer price index (CPI) and the retail price index (RPI). The CPI is used by the government as the main measure of inflation and part of the Bank of England's monetary policy remit is to achieve an inflation target of 2% pa. If inflation is more than 1% above or below this target, then the Governor of the Bank of England must write a letter to the Chancellor explaining why inflation has been significantly above (or below) the target. Over the last five years inflation has been outside the target band (1% to 3%) for 48 of the last 60 months. In the UK there are two key measures of price inflation, the consumer price index (CPI) and the retail price index (RPI). The CPI is used by the government as the main measure of inflation and part of the Bank of England's monetary policy remit is to achieve an inflation target of 2% pa. If inflation is more than 1% above or below this target, then the Governor of the Bank of England must write a letter to the Chancellor explaining why inflation has been significantly above (or below) the target. Over the last five years inflation has been outside the target band (1% to 3%) for 48 of the last 60 months.
The RPI is used for indexation of index-linked gilts and National Savings index-linked savings certificates. It has also been used for indexation of pensions and state benefits. However, in the June 2010 budget, the government announced that in the future pensions and state benefits would be indexed to CPI rather than RPI. There has therefore been renewed interest in the differences between CPI and RPI.
The Office for National Statistics publishes CPI and RPI data on a monthly basis and has recently published an information note to explain the differences.
In summary the main differences are:
- Calculation method: the RPI is an arithmetic index whereas CPI is a geometric index
- Constituents: the RPI includes housing costs, TV license, car tax and union subscriptions which are not in the CPI. The CPI includes charges and fees, such as investment fees and university fees, which are not included in RPI. The treatment of car prices varies by index, with the RPI using used car prices and the CPI using new car prices
- Population base: the RPI is representative of the majority of private UK households, but excludes the highest earners and pensioner households. The CPI is representative of all private UK households and includes the expenditure of institutional households and foreign visitors to the UK.
Generally, RPI inflation has been higher than CPI inflation. However, from September 2008 to December 2009 annual CPI inflation exceeded annual RPI inflation, the main reason for this was the fall in mortgage interest costs due to base rate cuts from 5.75% to 0.5%. For some months the annual RPI inflation rate was even negative. During 2010 this pattern has reversed as the falling costs have dropped out of the calculation.
However, the Bank of England's latest Inflation Report showed that the Bank expects inflation to remain high for the foreseeable future. Their inflation projections showed a probability of 35% that CPI inflation will exceed 2.5% in two years' time and a 40% probability that it will fall below 1.5%. The probability of the Governor needing to write a letter to the Chancellor to explain why inflation is outside the target range is very high at 58%. Thus times are likely to be tough for savers who are trying to maintain the value of their savings in real terms.
The simple answer is yes, but more importantly, will investment returns exceed inflation? To get growth in real terms it's the difference between investment returns and inflation rates that is key.
Last week's inflation report suggested that the Bank of England is expecting the Consumer Price Index (CPI) inflation rate to stay above its target of 2% well into 2011. After this, CPI inflation is expected to fall below 2%. Tomorrow morning the Office for National Statistics will publish the latest figures and economists are expecting a small improvement over July's figures of 3.2% for annual CPI inflation and 5% for annual retail price index (RPI) inflation. The table below shows the investment returns you would need to achieve just to keep pace with inflation at its current levels.
| Tax Status | Gross Return to match CPI | Gross Return to match RPI |
| Non taxpayer | 3.20% | 5.00% |
| Basic rate taxpayer | 4.00% | 6.25% |
| Higher rate taxpayer (40%) | 5.33% | 8.33% |
| Higher rate taxpayer (50%) | 6.40% | 10.00% |
The main difference between CPI and RPI is that RPI includes housing costs and CPI does not. Thus if you are a saver you have probably paid off your mortgage and so CPI is likely to be more relevant to you. If you have a mortgage, then the RPI is likely to reflect your situation better. If you are employed, then your earnings should be increasing more than inflation as earnings inflation usually outpaces price inflation. Therefore the rate of inflation you need to beat will depend on your own personal inflation rate and is likely to be for a time horizon much longer than a year.
In the mid 1980s I made my first major purchases and took out my first investment policy. I thought it would be interesting to look at the impact of inflation and investment returns following the decisions I made all those years ago. In 1986 I bought my first flat and in 1987 I bought my first car, a brand new Ford Fiesta 1.1 Popular Plus (the 'plus' was a rear windscreen wiper). At the same time I took out a low cost endowment policy with Norwich Union to repay the mortgage after 25 years.
The table below shows the value of each item at the start and the value today. These values have been used to calculate the total growth and annual growth rates over the term. The table also includes comparisons with CPI and RPI inflation for a similar term.
| Start Value | Current Value | Term in Years | Total Growth | Annual Inflation Rate for Period |
| CPI | 59.33 | 114.6 | 23.85 | 1.93 | 2.80% |
| RPI | 97.82 | 224.1 | 23.85 | 2.29 | 3.54% |
| Car | 5,000 | 11,345 | 23.09 | 2.33 | 3.73% |
| Endowment | 12,897 1 | 21,681 2 | 25.00 | - | 3.91%3 |
| Flat | 34,995 | 160,950 | 23.85 | 4.86 | 6.85% |
| Gross Salary | - | - | 25.25 | 17.36 | 11.97% |
Notes:
1 This is the total premium payable throughout the term rather than the start value
2 The value of existing sum assured and bonuses is 21,681.12 and the projected maturity value (using FSA rules) is 21,600 at 4% growth. Therefore it looks like the maturity value will be close to today's value.
3 This is the gross redemption yield based on the projected maturity value, which is the annual rate of return over the period.
Interestingly both car price and house price inflation have beaten both CPI and RPI inflation for the same period. However, I expect that today's brand new Ford Fiesta Studio probably has many more features than my original Popular Plus. House prices have seen inflation of around double that of the price indices but salary inflation has beaten all inflation measures by a long way.
As regards investment performance, I did not expect the endowment to perform well but it has at least beaten both measures of inflation and, as it is a qualifying policy, there should be no more tax to pay. The maturity value might even be enough to buy a new car, but not the one I am driving now.
 A discussion forum on IFA Life1 has reignited my interest in compound interest. A post called "compelling compounding" referred to an article with examples of the effect of compound interest on contributions over a long period of time, with early contributions benefiting from compounding more than later contributions.
Compound interest was one of the first subjects I studied and is one that I still use on a daily basis. My recollection of the study material was that it was all about a tree growing branches and the new branches and twigs were like compound interest. I still have the text book and this is what it says:
"The accumulation of a sum of money at compound interest may in fact be compared with the natural process of a plant or tree growing. When a tree grows the stem puts forth branches. These branches are like interest being added to the principal. They in turn throw off twigs, which also grow and are like the interest, which it has been postulated can be earned on the original interest, once it has been invested and thus become capital. The total amount by which the tree has increased over its original size in a given period is equivalent to the total interest which the principal has earned in that period. The obvious difference is that in natural growth there is no doubt about the continuity of the process..."
Source: Compound Interest and Annuities Certain by D.W.A. Donald
The real power of compound interest is the interest on the interest, which if you are a saver, is to your benefit and if you are a borrower is to your cost. The way banks and building societies make money is the 'interest turn' they earn, which is the difference between the (higher) rate they lend at and the (lower) rate they pay their savers. This is why it generally makes sense to pay off borrowings first before investing. Not only does it cost you more to borrow than you will earn on savings, but you have to repay borrowings out of after tax income and have tax deducted on your savings income.
Whilst the power of compound interest can increase the value of savings, inflation can erode the value of savings in real terms.
Inflation acts like a negative interest rate and dampens real growth. Therefore a goal for most people will be to beat inflation,
which has become more difficult recently after National Savings withdrew their inflation linked savings contracts. To illustrate
the effects of compound interest and inflation on returns I have posted some examples here.
Finally, the last sentence in the book extract above suggests there may be some doubt about the continuity of interest payments, apparently foreseeing the demise of interest on some deposit accounts. I guess this foresight should be no surprise as the author is an actuary.
1I have recently joined IFA Life, which is a professional networking
website for Financial Planners, IFAs, Mortgage Brokers, Life Planners and Wealth Managers. It's like LinkedIn or Facebook but just for
financial advisers.
|